原小米团队创建的开源项目,后面团队去了滴滴,再后来团队人员陆续解散,目前创始人已经自己开办公司快猫星云,现在openfalcon已经不维护,新出的另外一个开源监控产品叫夜莺,这是官网地址:Nightingale – 夜莺云原生监控 (n9e.github.io)
一,整个单机搭建,可以参照官方文档单机搭建步骤体验下,官方文档地址是:
单机安装 · GitBook (open-falcon.org)
二,分享下dashbord界面几个重要配置:
1,监控模板配置

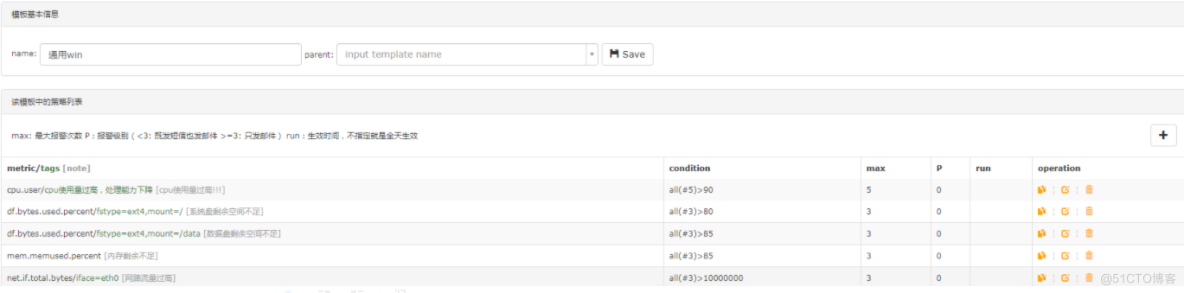
监控模板具有继承功能
2,nodata也可以配置,nodata就是监控补发值的意思,比如我监控一个服务监听端口,上传值1代表服务是监听状态,但是如果被监控机器如果出现满负载的情况下,无法推送监控值到服务端的话,那么需要我们给一个默认补发值,以此默认值判定服务出现了异常

3,Screen画布添加

counters列表内容
cpu.user
df.bytes.used.percent/fstype=ext4,mount=/
df.bytes.used.percent/fstype=ext4,mount=/data
disk.io.read_bytes/device=vdb
disk.io.util/device=vdb
disk.io.write_bytes/device=vdb
mem.memused.percent
net.if.in.bytes/iface=eth0
net.if.out.bytes/iface=eth0
net.if.total.bytes/iface=eth0
net.if.total.packets/iface=eth0
online/game=online,project=all
port/port=3306
三,openfalcon可以监控linux和windows主机,那么对于监控windows主机官方是没有现在agent可以下载的,需要我们编写自定义脚本去推送windows主机监控指标数据到服务端上,以下是windows主机监控自定义推送脚本,这个可以做成定时任务,跑在windows上
# !/usr/bin/env Python
# coding=utf8
import requests, json, random
import psutil
import time
import sys
import os
import platform
import pymysql, ConfigParser,pymssql


def get_cpu_info(hostname, step):
    t = int(time.time())
    # 危险值
    cpu_c = 90
    # 警告值
    cpu_w = 70
    # 间隔检查值
    cpu_i = 2
    cpu_times1 = psutil.cpu_times()
    time.sleep(cpu_i)
    cpu_times2 = psutil.cpu_times()
    checkos = platform.system()
    if checkos == "Windows":
        cpu_t1 = cpu_times1.user + cpu_times1.system + cpu_times1.idle + cpu_times1.interrupt + cpu_times1.dpc
        cpu_t2 = cpu_times2.user + cpu_times2.system + cpu_times2.idle + cpu_times2.interrupt + cpu_times2.dpc
        cpu_io = 0
        cpu_thread = psutil.cpu_count()
        cpu_speed = 2.39
        cpu_idle = (cpu_times2.idle - cpu_times1.idle) * 100 / (cpu_t2 - cpu_t1)
        cpu_user = (cpu_times2.user - cpu_times1.user) * 100 / (cpu_t2 - cpu_t1)
        cpu_sys = (cpu_times2.system - cpu_times1.system) * 100 / (cpu_t2 - cpu_t1)
        cpu_usep = 100 - cpu_idle
        cpu_usep = psutil.cpu_percent(interval=cpu_i)
        cpu_data = [{'endpoint': hostname, 'tags': None, 'timestamp': t, 'metric': 'cpu.idle', 'value': cpu_idle,
                     'counterType': 'GAUGE', 'step': step},
                    {'endpoint': hostname, 'tags': None, 'timestamp': t, 'metric': 'cpu.user', 'value': cpu_user,
                     'counterType': 'GAUGE', 'step': step},
                    {'endpoint': hostname, 'tags': None, 'timestamp': t, 'metric': 'cpu.sys', 'value': cpu_sys,
                     'counterType': 'GAUGE', 'step': step},
                    {'endpoint': hostname, 'tags': None, 'timestamp': t, 'metric': 'cpu.system', 'value': cpu_sys,
                     'counterType': 'GAUGE', 'step': step}
                    ]
    else:
        cpu_data = []
    return cpu_data


# 获取内存信息
def get_mem_info(hostname, step):
    t = int(time.time())
    # 危险值
    mem_c = 80
    # 警告值
    mem_w = 60
    mem_info = psutil.virtual_memory()
    swap_info = psutil.swap_memory()
    # 内存
    mem_total = mem_info.total
    mem_usep = mem_info.percent
    mem_memfree = 100 - mem_usep
    mem_t = mem_info.total / 1000
    mem_user = mem_info.used / 1000
    # 交换空间
    swap_usep = swap_info.percent
    swap_user = swap_info.used / 1000
    swap_cache = 0
    # 游戏实际使用内存
    memres_usep = mem_usep
    memres_user = mem_user
    memres_game = 0
    mem_data = [
        {'endpoint': hostname, 'tags': None, 'timestamp': t, 'metric': 'mem.swapused.percent', 'value': swap_usep,
         'counterType': 'GAUGE', 'step': step},
        {'endpoint': hostname, 'tags': None, 'timestamp': t, 'metric': 'mem.memused.percent', 'value': mem_usep,
         'counterType': 'GAUGE', 'step': step},
        {'endpoint': hostname, 'tags': None, 'timestamp': t, 'metric': 'mem.memtotal', 'value': mem_total,
         'counterType': 'GAUGE', 'step': step}]
    return mem_data


# 磁盘名称
# 获取磁盘
def get_disk_info(hostname, step):
    t = int(time.time())
    # 危险值
    disk_c = 85
    # 警告值
    disk_w = 80
    disk_id = []
    # 将每个磁盘的total used free percent 分别存入到相应的list
    disk_total = []
    disk_used = []
    disk_free = []
    disk_percent = []
    disk_all = {}
    for id in psutil.disk_partitions():
        if 'cdrom' in id.opts or id.fstype == '':
            continue
        disk_name = id.device.split(':')
        s = disk_name[0]
        disk_id.append(s)
        disk_info = psutil.disk_usage(id.device)  # sh
        disk_total.append(disk_info.total)
        disk_used.append(disk_info.used)
        disk_free.append(disk_info.free)
        disk_percent.append(disk_info.percent)
    #    for i in range(len(disk_id)):
    #        print u'%s盘空闲率: %s %%  %s' % (disk_id[i],100 - disk_percent[i],disk_info,)

    disk_c_t = round(disk_total[0], 2)  # c硬盘总空间大小
    disk_c_user = round(disk_used[0], 2)  # c已使用的空间
    disk_c_usep = round(disk_used[0] / float(disk_total[0]) * 100, 2)  # c已使用空间百分比
    disk_c_idlep = 100 - disk_c_usep  # c剩余硬盘百分比
    disk_d_t = round(disk_total[1], 2)  # d硬盘总空间大小
    disk_d_user = round(disk_used[1], 2)  # d已使用的空间
    disk_d_usep = round(disk_used[1] / float(disk_total[1]) * 100, 2)  # d已使用空间百分比
    disk_d_idlep = 100 - disk_d_usep  # d剩余硬盘百分比
    #    disk_all = {disk_info_disk_C,disk_info_disk_D}
    disk_data = [{'endpoint': hostname, 'tags': "fstype=ext4,mount=/", 'timestamp': t, 'metric': 'df.bytes.total',
                  'value': disk_c_t, 'counterType': 'GAUGE', 'step': step},
                 {'endpoint': hostname, 'tags': "fstype=ext4,mount=/", 'timestamp': t,
                  'metric': 'df.bytes.free.percent', 'value': disk_c_idlep, 'counterType': 'GAUGE', 'step': step},
                 {'endpoint': hostname, 'tags': "fstype=ext4,mount=/", 'timestamp': t, 'metric': 'df.bytes.used',
                  'value': disk_c_user, 'counterType': 'GAUGE', 'step': step},
                 {'endpoint': hostname, 'tags': "fstype=ext4,mount=/", 'timestamp': t,
                  'metric': 'df.bytes.used.percent', 'value': disk_c_usep, 'counterType': 'GAUGE', 'step': step},
                 {'endpoint': hostname, 'tags': "fstype=ext4,mount=/data", 'timestamp': t, 'metric': 'df.bytes.total',
                  'value': disk_d_t, 'counterType': 'GAUGE', 'step': step},
                 {'endpoint': hostname, 'tags': "fstype=ext4,mount=/data", 'timestamp': t,
                  'metric': 'df.bytes.free.percent', 'value': disk_d_idlep, 'counterType': 'GAUGE', 'step': step},
                 {'endpoint': hostname, 'tags': "fstype=ext4,mount=/data", 'timestamp': t, 'metric': 'df.bytes.used',
                  'value': disk_d_user, 'counterType': 'GAUGE', 'step': step},
                 {'endpoint': hostname, 'tags': "fstype=ext4,mount=/data", 'timestamp': t,
                  'metric': 'df.bytes.used.percent', 'value': disk_d_usep, 'counterType': 'GAUGE', 'step': step},
                 ]

    return disk_data


def get_network_info(hostname, step):
    t = int(time.time())
    checkos = platform.system()
    if checkos == "Windows":
        net_info = psutil.net_io_counters()
        time.sleep(1)
        net_info1 = psutil.net_io_counters()
        net_sent = net_info1.bytes_sent - net_info.bytes_sent
        net_recv = net_info1.bytes_recv - net_info.bytes_recv
        net_psent = net_info1.packets_sent - net_info.packets_sent
        net_precv = net_info1.packets_recv - net_info.packets_recv
        net_speed = net_sent + net_recv
        net_pspeed = net_psent + net_precv
        net_info_dict = {'net.if.in.bytes': [net_recv, "iface=eth0"], 'net.if.out.bytes': [net_sent, "iface=eth0"],
                         'net.if.in.packets': [net_precv, "iface=eth0"],
                         'net.if.out.packets': [net_psent, "iface=eth0"],
                         'net.if.total.bytes': [net_speed, "iface=eth0"],
                         'net.if.total.packets': [net_pspeed, 'iface=eth0'], 'agent.alive': [1, None]}
        net_data = [
            {'endpoint': hostname, 'tags': "iface=eth0", 'timestamp': t, 'metric': 'net.if.in.bytes', 'value': net_recv,
             'counterType': 'GAUGE', 'step': step},
            {'endpoint': hostname, 'tags': "iface=eth0", 'timestamp': t, 'metric': 'net.if.out.bytes',
             'value': net_sent, 'counterType': 'GAUGE', 'step': step},
            {'endpoint': hostname, 'tags': "iface=eth0", 'timestamp': t, 'metric': 'net.if.in.packets',
             'value': net_precv, 'counterType': 'GAUGE', 'step': step},
            {'endpoint': hostname, 'tags': "iface=eth0", 'timestamp': t, 'metric': 'net.if.total.bytes',
             'value': net_speed, 'counterType': 'GAUGE', 'step': step},
            {'endpoint': hostname, 'tags': "iface=eth0", 'timestamp': t, 'metric': 'net.if.total.packets',
             'value': net_pspeed, 'counterType': 'GAUGE', 'step': step},
            ]
    else:
        net_data = []
    return net_data


def get_io_info(hostname, step):
    t = int(time.time())
    checkos = platform.system()
    if checkos == "Windows":
        '''
        c盘io
        '''
        io_info_c = os.popen(
            "wmic path Win32_PerfFormattedData_PerfDisk_LogicalDisk get Name,DiskTransfersPerSec,DiskReadBytesPerSec,DiskWriteBytesPerSec|grep 'C:'").read().strip()
        io_read_c = io_info_c.split()[0]
        io_p_c = io_info_c.split()[1]
        io_write_c = io_info_c.split()[2]
        io_t_c = int(io_read_c) + int(io_write_c)
        '''
        d盘io
        '''
        io_info_d = os.popen(
            "wmic path Win32_PerfFormattedData_PerfDisk_LogicalDisk get Name,DiskTransfersPerSec,DiskReadBytesPerSec,DiskWriteBytesPerSec|grep 'D:'").read().strip()
        io_read_d = io_info_d.split()[0]
        io_p_d = io_info_d.split()[1]
        io_write_d = io_info_d.split()[2]
        io_t_d = int(io_read_d) + int(io_write_d)
        io_info_c = {'disk.io.read_bytes': [io_read_c, 'device=vda'], 'disk.io.write_bytes': [io_write_c, 'device=vda'],
                     'disk.io.util': [io_t_c, 'device=vda']}
        io_info_d = {'disk.io.read_bytes': [io_read_d, 'device=vdb'], 'disk.io.write_bytes': [io_write_d, 'device=vdb'],
                     'disk.io.util': [io_t_d, 'device=vdb']}
        io_data = [{'endpoint': hostname, 'tags': "device=vda", 'timestamp': t, 'metric': 'disk.io.read_bytes',
                    'value': io_read_c, 'counterType': 'GAUGE', 'step': step},
                   {'endpoint': hostname, 'tags': "device=vdb", 'timestamp': t, 'metric': 'disk.io.read_bytes',
                    "value": io_read_d, 'counterType': 'GAUGE', 'step': step},
                   {'endpoint': hostname, 'tags': "device=vda", 'timestamp': t, 'metric': 'disk.io.write_bytes',
                    'value': io_write_c, 'counterType': 'GAUGE', 'step': step},
                   {'endpoint': hostname, 'tags': "device=vda", 'timestamp': t, 'metric': 'disk.io.util',
                    'value': io_t_c, 'counterType': 'GAUGE', 'step': step},
                   {'endpoint': hostname, 'tags': "device=vdb", 'timestamp': t, 'metric': 'disk.io.write_bytes',
                    'value': io_write_d, 'counterType': 'GAUGE', 'step': step},
                   {'endpoint': hostname, 'tags': "device=vdb", 'timestamp': t, 'metric': 'disk.io.util',
                    'value': io_t_d, 'counterType': 'GAUGE', 'step': step},
                   ]
    else:
        io_data = []
    return io_data


def tcp_content(hostname, step):
    t = int(time.time())
    tcp_es = os.popen('netstat -ano|find "ESTABLISHED" /c').read().strip().replace('r', '').replace('n', '')
    tcp_listen = os.popen('netstat -ano|find "LISTENING" /c').read().strip().replace('r', '').replace('n', '')
    tcp_wait = os.popen('netstat -ano|find "TIME_WAIT" /c').read().strip().replace('r', '').replace('n', '')
    # print(tcp_es,tcp_listen)
    tcp_data = [{'endpoint': hostname, 'tags': "count", 'timestamp': t, 'metric': 'tcp.listen', 'value': tcp_es,
                 'counterType': 'GAUGE', 'step': step},
                {'endpoint': hostname, 'tags': "count", 'timestamp': t, 'metric': 'tcp.established',
                 "value": tcp_listen, 'counterType': 'GAUGE', 'step': step},
                {'endpoint': hostname, 'tags': "count", 'timestamp': t, 'metric': 'tcp.time.wait', "value": tcp_wait,
                 'counterType': 'GAUGE', 'step': step},
                ]
    # print(tcp_data)
    return tcp_data


def get_hostname(ip):
    t = int(time.time())
    try:
        with open(r'c:cygwinrootetchostname.txt', 'r') as fp:
            host_name = fp.read().strip()
    except Exception,e:
        print e
        ip = requests.get(r'http://106.14.207.70:888/count/getip').text.strip()
        # print(ip)
        host_name = ip
    return host_name


# def mysql_log(hostname):
# t=time.strftime("%Y-%m-%d %H:%M:%S")
###print(t,type(t))
# month=time.strftime("%Y-%m")
# user="root"
# pwd="ODUwNmQxYzxycq2017."
# log_path="D:mysqllogs"
# sql1="SELECT id, user, command, time, state, info FROM information_schema.processlist WHERE command != 'sleep';"
# sql2=" SELECT * FROM information_schema.innodb_locksG "
# sql3=" SELECT * FROM information_schema.innodb_trxG "
# processlist='mysql -u%s -p%s -e "%s"' %(user,pwd,sql1)
# innodb_locks='mysql -u%s -p%s -e "%s"' %(user,pwd,sql2)
# innodb_trx='mysql -u%s -p%s -e "%s"' %(user,pwd,sql3)
# print(processlist)
# print(innodb_locks)
# log_file=open(r'%s%s.log' %(log_path,month),'a')
# log_file.write("Start-time-----"+t)
# log_file.write('n')
# log_file.write("----information_schema.processlist---n")
# log_file.write("t"+os.popen(processlist).read())
# log_file.write('n')
# log_file.write("----information_schema.innodb_locks---n")
# log_file.write("t"+os.popen(innodb_locks).read())
# log_file.write('n')
# log_file.write("----information_schema.innodb_trx---n")
# log_file.write("t"+os.popen(innodb_locks).read()+'n')
# log_file.write("End_time---%s"'n' %(time.strftime("%Y-%m-%d %H:%M:%S")))
# log_file.close()

def connect(host, user, password, dbname):
    try:
        conn = pymssql.connect(host=host, user=user, password=password, database=dbname,timeout=40)
    except pymysql.OperationalError:  # 账号或密码等等错误
        print('连接失败!')
        return None
    cur = conn.cursor()  # 游标
    return cur


def exec_sql(cmd, cur):
    cur.execute(cmd)
    num = cur.fetchone()  # 返回在线数量
    return num


def online_info(hostname, step):
    t = int(time.time())
    host = '127.0.0.1'
    online_data = []  # 所有渠道的空列表
    all_oper = []
    try:
        user = os.popen("grep sDBUser /cygdrive/d/game/server/*_s*/Config.json").readline().strip().split('"')[3]
        password = os.popen("grep sDBPsw /cygdrive/d/game/server/*_s*/Config.json").readline().strip().split('"')[-2]
        game_dirs = os.listdir('d:/game/server/')  # 生成game_dirs列表,3v3没有server目录
    except:
        pass
    else:
        # os.popen("grep sDBName /cygdrive/d/game/server/cssy_android_gaore_s10338/Config.json").read().strip().split('"')[-2]
        db_list = []
        for game_dir in game_dirs:
            if os.path.isdir('d:/game/server/%s' % game_dir):  # server目录下有个执行脚本,防止报错
                status = os.popen("cat /cygdrive/d/game/server/%s/scripts/run_status" % game_dir).read().strip()
                if int(status) != 2:  # 当状态值不为2时生成db_name,状态值为2为被合服
                    #                   print(status)
                    db_name = os.popen("grep sDBName /cygdrive/d/game/server/%s/Config.json" % game_dir).read().strip().split('"')[-2]
                    db_list.append(db_name)
        #    print(db)
        #    for db_name in db:
        #        db_list.append(db_name.split('"')[-2])
        all_online_num = 0
        for dbname in db_list:
            cur = connect(host, user, password, dbname)  # 进行连接 返回
            if cur:
                cmd = 'select top 1 OnlineCount from Mir_Online  ORDER by UpdateTime DESC '  # 查询在线人数
                print(cmd)
                num = exec_sql(cmd, cur)
                if num:  # 判断在线数量是否为空
                    all_online_num = all_online_num + num[0]
                    dbname = {'online': [num[0], 'game=online,project=%s' % dbname]}
                    all_oper.append(dbname)
                    online_data = online_data + [
                        {'endpoint': hostname, 'tags': 'game=online,project=%s' % dbname, 'timestamp': t,
                         'metric': 'online', 'value': num[0], 'counterType': 'GAUGE', 'step': step}]
                    cur.close()
            else:
                return None
        online_data = online_data + [
            {'endpoint': hostname, 'tags': "game=online,project=all", 'timestamp': t, 'metric': 'online',
             'value': all_online_num, 'counterType': 'GAUGE', 'step': step}]
        # all_oper.append(online_data)
    return online_data


def post_data():
    step = 60
    ip = requests.get(r'http://106.14.207.70:888/count/getip').text.strip()
    # print(ip)
    hostname = get_hostname(ip)
    # print(hostname)
    # mysql_log(hostname)
    url_list = ["http://xx.xxx.xxx.xxx:1988/v1/push", "http://xx.xxx.xxx.xx:1988/v1/push",
                "http://xx.xx.xx.xx:1988/v1/push"]
    try:
        cpu_data = get_cpu_info(hostname, step)
        mem_data = get_mem_info(hostname, step)
        disk_data = get_disk_info(hostname, step)
        net_data = get_network_info(hostname, step)
        io_data = get_io_info(hostname, step)
        tcp_data = tcp_content(hostname, step)
        online_data = online_info(hostname, step)
        # print(cpu_data,mem_data,disk_data,net_data,io_data)
        data = cpu_data + mem_data + disk_data + net_data + io_data + tcp_data + online_data
        print(data)
        url = random.choice(url_list)
        req = requests.post(url=url, data=json.dumps(data), timeout=30)
        print(req.text)
    except Exception, e:
        print e


if __name__ == "__main__":
    post_data()
四,openfalcon可以监控多种服务,数据库,中间件,域名,功能强大,下面分享对redis和rabbitmq的监控编写的脚本
监控redis的
#!/bin/env python
#-*- coding:utf-8 -*-

__author__ = 'iambocai'

import json
import time
import socket
import os
import re
import sys
import commands
import urllib2, base64

class RedisStats:
    # 如果你是自己编译部署到redis,请将下面的值替换为你到redis-cli路径
    _redis_cli = '/usr/bin/redis-cli'
    _stat_regex = re.compile(ur'(w+):([0-9]+.?[0-9]*)r')

    def __init__(self,  port='6379', passwd=None, host='127.0.0.1'):
        self._cmd = '%s -h %s -p %s info' % (self._redis_cli, host, port)
        if passwd not in ['', None]:
            self._cmd = '%s -h %s -p %s -a %s info' % (self._redis_cli, host, port, passwd)

    def stats(self):
        ' Return a dict containing redis stats '
        info = commands.getoutput(self._cmd)
        return dict(self._stat_regex.findall(info))


def main():
    ip = socket.gethostname()
    timestamp = int(time.time())
    step = 60
    # inst_list中保存了redis配置文件列表,程序将从这些配置中读取port和password,建议使用动态发现的方法获得,如:
    # inst_list = [ i for i in commands.getoutput("find  /etc/ -name 'redis*.conf'" ).split('n') ]
    insts_list = [ '/etc/redis.conf' ]
    p = []

    monit_keys = [
        ('connected_clients','GAUGE'),
        ('blocked_clients','GAUGE'),
        ('used_memory','GAUGE'),
        ('used_memory_rss','GAUGE'),
        ('mem_fragmentation_ratio','GAUGE'),
        ('total_commands_processed','COUNTER'),
        ('rejected_connections','COUNTER'),
        ('expired_keys','COUNTER'),
        ('evicted_keys','COUNTER'),
        ('keyspace_hits','COUNTER'),
        ('keyspace_misses','COUNTER'),
        ('keyspace_hit_ratio','GAUGE'),
    ]

    for inst in insts_list:
        port = commands.getoutput("sed -n 's/^port *([0-9]{4,5})/\1/p' %s" % inst)
        passwd = commands.getoutput("sed -n 's/^requirepass *([^ ]*)/\1/p' %s" % inst)
        metric = "redis"
        endpoint = ip
        tags = 'port=%s' % port

        try:
            conn = RedisStats(port, passwd)
            stats = conn.stats()
        except Exception,e:
            continue

        for key,vtype in monit_keys:
            #一些老版本的redis中info输出的信息很少,如果缺少一些我们需要采集的key就跳过
            if key not in stats.keys():
                continue
            #计算命中率
            if key == 'keyspace_hit_ratio':
                try:
                    value = float(stats['keyspace_hits'])/(int(stats['keyspace_hits']) + int(stats['keyspace_misses']))
                except ZeroDivisionError:
                    value = 0
            #碎片率是浮点数
            elif key == 'mem_fragmentation_ratio':
                value = float(stats[key])
            else:
                #其他的都采集成counter,int
                try:
                    value = int(stats[key])
                except:
                    continue

            i = {
                'Metric': '%s.%s' % (metric, key),
                'Endpoint': endpoint,
                'Timestamp': timestamp,
                'Step': step,
                'Value': value,
                'CounterType': vtype,
                'TAGS': tags
            }
            p.append(i)


    print json.dumps(p, sort_keys=True,indent=4)
    method = "POST"
    handler = urllib2.HTTPHandler()
    opener = urllib2.build_opener(handler)
    url = 'http://127.0.0.1:1988/v1/push'
    request = urllib2.Request(url, data=json.dumps(p) )
    request.add_header("Content-Type",'application/json')
    request.get_method = lambda: method
    try:
        connection = opener.open(request)
    except urllib2.HTTPError,e:
        connection = e

    # check. Substitute with appropriate HTTP code.
    if connection.code == 200:
        print connection.read()
    else:
        print '{"err":1,"msg":"%s"}' % connection
if __name__ == '__main__':
    proc = commands.getoutput(' ps -ef|grep %s|grep -v grep|wc -l ' % os.path.basename(sys.argv[0]))
    sys.stdout.flush()
    #print proc
    if int(proc)
监控mq的
#!/bin/env python
#-*- coding:utf-8 -*-

__author__ = 'pengyang'

import sys, urllib2, base64, json, time,socket


step = 60
ip = socket.gethostname()
ts = int(time.time())
keys = (u'messages_ready', u'messages_unacknowledged')
rates = ('ack', 'deliver', 'deliver_get', 'publish')

request = urllib2.Request("http://%s:15672/api/queues" %ip)
# see #issue4
base64string = base64.b64encode('fx_jiuzhou:boDmZ9IorfMVV5Wu')
request.add_header("Authorization", "Basic %s" % base64string)
result = urllib2.urlopen(request)
data = json.loads(result.read())
tag = ''
#tag = sys.argv[1].replace('_',',').replace('.','=')

p = []
for queue in data:
	# ready and unack
        print queue
	msg_total = 0
	for key in keys:
		q = {}
		q["endpoint"] = ip
		q['timestamp'] = ts
		q['step'] = step
		q['counterType'] = "GAUGE"
		q['metric'] = 'rabbitmq.%s' % key
		q['tags'] = 'name=%s,%s' % (queue['name'],tag)
                #print queue[key]
                if key in queue:
		  q['value'] = int(queue[key])
                  msg_total += q['value']
                else:
                  pass
		p.append(q)

	# total
	q = {}
	q["endpoint"] = ip
	q['timestamp'] = ts
	q['step'] = step
	q['counterType'] = "GAUGE"
	q['metric'] = 'rabbitmq.messages_total'
	q['tags'] = 'name=%s,%s' % (queue['name'],tag)
	q['value'] = msg_total
	p.append(q)

	# rates
	for rate in rates:
		q = {}
		q["endpoint"] = ip
		q['timestamp'] = ts
		q['step'] = step
		q['counterType'] = "GAUGE"
		q['metric'] = 'rabbitmq.%s_rate' % rate
		q['tags'] = 'name=%s,%s' % (queue['name'],tag)
		try:
			q['value'] = int(queue['message_stats']["%s_details" % rate]['rate'])
		except:
			q['value'] = 0
		p.append(q)

print json.dumps(p, indent=4)


method = "POST"
handler = urllib2.HTTPHandler()
opener = urllib2.build_opener(handler)
url = 'http://xx.xxx.xxx.xx:1988/v1/push'
request = urllib2.Request(url, data=json.dumps(p) )
request.add_header("Content-Type",'application/json')
request.get_method = lambda: method
try:
    connection = opener.open(request)
except urllib2.HTTPError,e:
    connection = e

# check. Substitute with appropriate HTTP code.
if connection.code == 200:
    print connection.read()
else:
    print '{"err":1,"msg":"%s"}' % connection
五,报警类型丰富,支持钉钉,邮件,短信,电话…
下面分享下对于短信报警改如何对接,首先你得去云商那边申请一个短信模板,模板审核通过后,通过阿里云api方式能调用短信
最后再进行一层封装成接口这种http://ops.xxx.xxx.com/dns/api/v2/sms/send/(这一层不会的话可以让公司运维开发去编写),方便给短信报警脚本去调用,短信报警脚本,脚本名字openfalcon_sms.py如下:
# coding=utf-8
import sys

import time
import hashlib
import urllib
import urllib.request
from flask import Flask, request
import json
import requests

_author_ = 'peng'
'''
短信接口
'''
app = Flask(__name__)


@app.route('/sms/send', methods=['GET', 'POST'])
def check():
    # 默认返回内容
    if request.method == 'POST':
        return_dict = {'code': '0', 'message': '处理成功'}
        # 判断参数是否为空
        if request.args is None:
            return_dict['code'] = '5004'
            return_dict['message'] = '请求参数为空'
            return json.dumps(return_dict, ensure_ascii=False)
        # 获取传入的参数
        mobile = request.form['tos']  # 获取收件人手机号
        content = request.form['content']  # 获取语音内容
        statu = content.split('[]')[0].replace('[', '').replace(']', ' ').strip().split(' ')[1]  # 获取状态
        host = content.split('[]')[0].replace('[', '').replace(']', ' ').strip().split(' ')[2]  # 获取主机
        msg = content.split('[]')[1].replace('[', '').replace(']', ' ').strip().split(' ')[0]  # 获取报警信息
        value = content.split('[]')[1].replace('[', '').replace(']', ' ').strip().split(' ')[4].split('>')[0]  # 报警值
        if statu == "PROBLEM":
            # content="主机%s%s当前值为%s"%(host,msg,value)
            # mobile = mobile.split(',')  #可以添加多个联系人
            # for i in mobile:
            send(mobile, content, host)
        return content


def send(mobile, content, host):
    url = 'http://ops.xxx.xxx.com/dns/api/v2/sms/send/'  # 请求地址,使用时修改为线上地址
    data = {
        "project": "lyzt",
        'supply': "jw",  # 供应商简称 九玩: jw, 盛和: sh
        'tpl_code': "SMS_202810705",
        'tpl_params': {},
        "phones": mobile
    }
    tpl_params = {
        "name": host,
        "msg": content
    }
    data["tpl_params"] = json.dumps(tpl_params)
    token = 'kum0qroumm1nueur'

    # 键值对按key排序
    sdata = sorted(data.items())
    s_list = []
    for s in sdata:
        s_list.append('%s=%s' % (s[0], s[1]))
    nstr = '&'.join(s_list)

    # 对生成字符串md5加密
    m = hashlib.md5()
    m.update((nstr + token).encode())
    sign = m.hexdigest()
    # sign加入请求参数
    data['sign'] = sign
    print(data)
    # 发送请求
    res = requests.post(url, data=data, timeout=300)
    result = res.json()
    print(result)
    # req = urllib.request.urlopen(
    #    url = 'http://ops.xx.xxxx.com/dns/api/v2/sms/send/',#平台发送短信请求地址
    #    data = urllib.parse.urlencode(data).encode('utf-8')
    # )
    # content  = req.text
    # print(content)


if __name__ == '__main__':
    app.run(
        debug=True
    )
然后将这个脚本运行放到后台去运行
screen -R "短信报警"
python3  openfalcon_sms.py
然后修改alarm配置文件
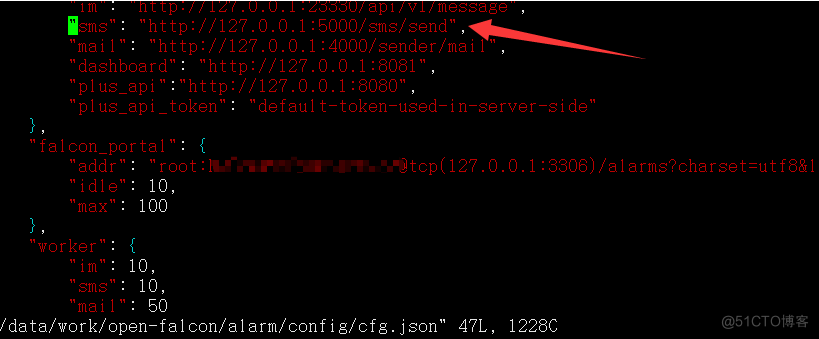
最后重启alarm组件,那么短信报警媒介到这里就配置完成了
六,openfalcon graph负载均衡搭建,现在随着公司机器越来越多,单机架构无法支撑起上万台机器数据的监控要求,可以对graph组件做扩展,下面是配置新graph节点过程:
新节点环境安装:首先购买机器和之前的机器需内网互通,进行简单的环境部署,wget http://repo.mysql.com/mysql-community-release-el7-5.noarch.rpm&&rpm -ivh mysql-community-release-el7-5.noarch.rpm&&systemctl start mysql&&systemctl enable mysqld.service,然后拿出事先准备好的已编译好的包拿到服务器上解压,然后初始化数据库
mysql -uroot -pNsSwEvf37De6CecB5kt
mysql -uroot -pNsSwEvf37De6CecB5kt
mysql -uroot -pNsSwEvf37De6CecB5kt
mysql -uroot -pNsSwEvf37De6CecB5kt
mysql -uroot -pNsSwEvf37De6CecB5kt
过程简单不用赘述
整个扩容访问原理:
从修改Transfer开始,流量会按新的哈希规则进入到原始集群和扩容集群;此时扩容集群发现,migrate开关是打开状态;于是,扩容集群接收到流量之后,并没有很着急的去落盘,而是先按照旧的哈希规则从原始集群拉取历史数据(本质上就是一个rrd文件),拉取成功则将整个rrd文件写入本地,若拉取超时(默认1s),则将此次接收到的数据发送给旧的集群,下一个周期会再次重复此过程。
同样的,Query的查询,也是按照新的哈希规则。当查询的流量到达扩容集群,如果Graph发现,本地已有RRD文件,则直接查询返回;如果本地无RRD文件,则Graph会通过旧的哈希规则,去原始集群中拉取到旧数据;然后跟自己cache中的数据做一个聚合,再返回给查询者。
整个过程从技术上来说,可以说是:无损的、可以热迁移。
流程:
- 修改新增加的graph的cfg.json
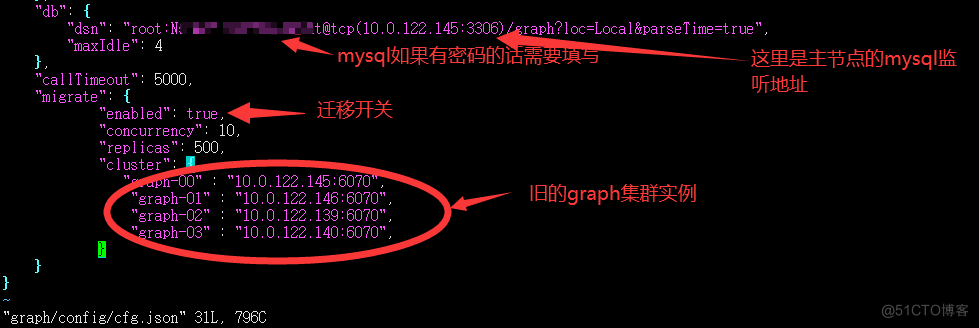
- 启动新增加节点的graph

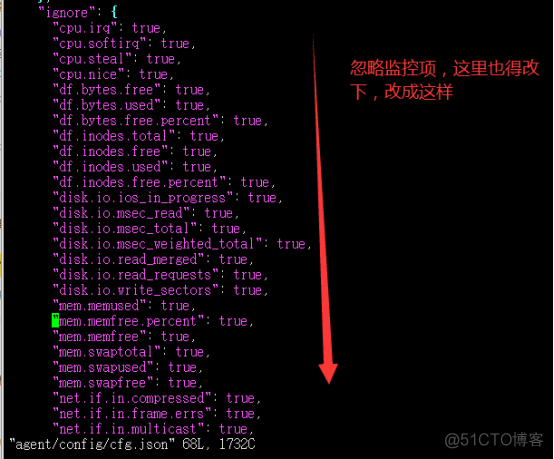
3.修改新增节点的agent

4,新增节点启动agent,这个组件可要可不要,如果后面你自定义推送脚本有用到这个:1988的话那么这个组件还是得启动的
- 重启所有节点的graph需要注意的是:当我们执行./open-falcon restart graph这个命令重启时,日志显示如下:
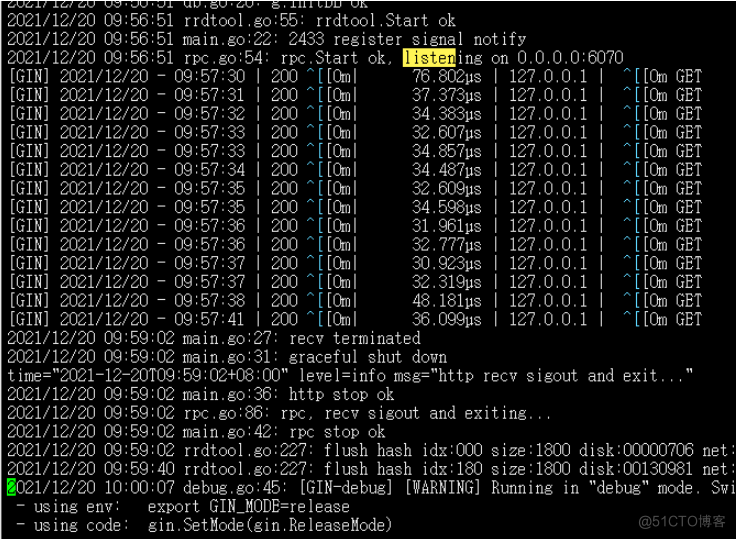
明显还在强制数据落盘,但是6070端口并没有监听起来,很好的一个检查方式就是我们主节点telnet下

因为我买的节点都是内网互通所以可以这样探测
所以你需要先检出graph的pid

然后强制kill -9 13475
然后重新启动./open-falcon restart graph
启动成功的日志显示应该是这样的

6.修改所有节点的transfer的cfg.json如下:

7.重启所有节点的transfer
这时候,transfer就会将接收到的数据,发送给扩容后的graph实例;同时graph实例,会自动进行数据的rebalance,rebalance的过程持续时间长短,与待迁移的counter数量以及graph机器的负载、性能有关系。
8.修改主节点的api的配置,并重启api进程
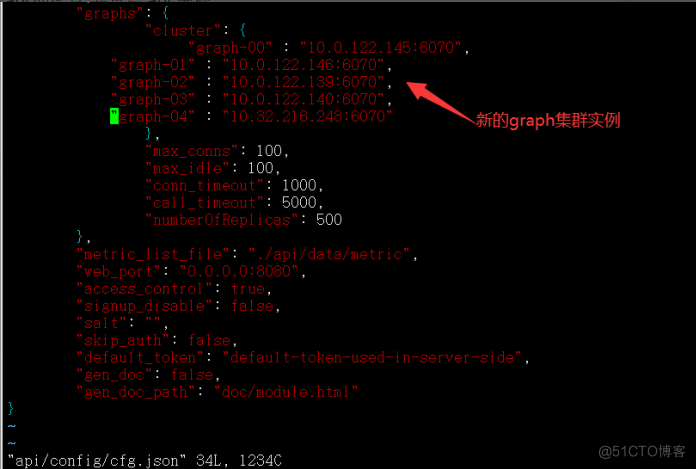
./open-falcon restart api
9.到此扩容动作基本完成,如何确认数据rebalance已经完成?
目前只能通过观察graph内部的计数器,来判断整个数据迁移工作是否完成;观察方法如下:对所有新扩容的graph实例,访问其统计接口http://127.0.0.1:6071/counter/migrate 观察到所有的计数器都不再变化,那么就意味着迁移工作完成啦。
新增扩容节点迁移完成后关闭graph中的migrate后服务重启。
总结:
扩容失败会导致迁移期间数据丢失,总之开弓没有回头箭,而且我们还可以通过画布查询看监控指标是否丢失判断扩容是否成功,失败案例显示:

参考文档:https://book.open-falcon.org/zh_0_2/practice/graph-scaling.html
服务器租用托管,机房租用托管,主机租用托管,https://www.e1idc.com